
|
Often one is given (or can compute) a table that represents the probability mass function for a given discrete random variable of interest. One can use both R and Excel, in combination with such a table, to find expected values, variances, and standard deviations for the related discrete random variable. One can also use R and Excel to simulate any number of realizations of that random variable.
The following demonstrates these things for a random variable $X$ whose probability mass function is given by: $$\begin{array}{l|c|c|c|c} X & -4 & 2 & 5 & 10\\\hline P(X) & 0.50 & 0.30 & 0.15 & 0.05 \end{array}$$
R: First, we translate the table representing the probability mass function into two vectors:
> X.outcomes = c(-4,2,5,10)
> X.probabilities = c(0.50,0.30,0.15,0.05)
Then, assuming $S$ is the sample space of all possible $x$ values associated with $X$, we use these two vectors to calculate the expected value $E(X)$, variance $Var(X)$, and standard deviation $SD(X)$ in accordance with the formulas: $$E(X) = \sum_{x \in S} x P(x) \quad \quad \quad Var(X) = \left[ \sum_{x \in S} x^2 P(x) \right] - \mu^2 \quad \quad \quad SD(X) = \sqrt{Var(X)}$$
To find the expected value of $X$, remembering that vector multiplication is done pair-wise, we use:
> X.expectedValue = sum(X.outcomes * X.probabilities)
> X.expectedValue
[1] -0.15
To calculate the variance of $X$:
> X.variance = sum(X.outcomes^2 * X.probabilities) - X.expectedValue^2
> X.variance
[1] 17.9275
Finally, to calculate the standard deviation of $X$:
> X.standardDeviation = sqrt(X.variance)
> X.standardDeviation
[1] 4.234088
Excel:
The SUMPRODUCT() function can help in finding the expected value, variance, and standard deviation of a random variable $X$ when given the probability mass function as a table.
If applied to two ranges $R_1=\{4,6,7,-3\}$ and $R_2=\{6,8,-5,7\}$ in a worksheet, $\textrm{SUMPRODUCT}(R_1,R_2)$ finds the sum of the pairwise products of elements from $R_1$ and $R_2$:
$$\textrm{SUMPRODUCT}(R_1,R_2) = (4)(6) + (6)(8) + (7)(-5) + (-3)(7) = 16$$Now note how this formula can be used to calculate $E(X)$, $Var(X)$, and $SD(X)$ in an Excel worksheet:
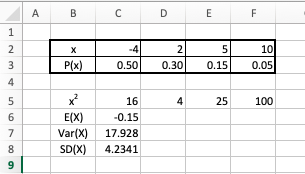
The following formulas are used in the worksheet above:
C5:"=C2^2" (copied to D2:F2)" (copied to D2:F2)
C6:"=SUMPRODUCT(C2:F2,C3:F3)"
C7:"=SUMPRODUCT(C5:F5,C3:F3) - C6^2"
C8:"=SQRT(C7)"
Often, one wishes to simulate some number of realizations of a discrete random variable whose probability mass function given as a table. Again using the random variable $X$ with probability mass function
$$\begin{array}{l|c|c|c|c} X & -4 & 2 & 5 & 10\\\hline P(X) & 0.50 & 0.30 & 0.15 & 0.05 \end{array}$$We can accomplish these simulations with:
R: As was previously done, for better readability we first translate the table representing the probability mass function into two vectors:
> X.outcomes = c(-4,2,5,10)
> X.probabilities = c(0.50,0.30,0.15,0.05)
Then, we can simulate 10 realizations of $X$ with
> sample(x=X.outcomes, size=10, replace=TRUE, prob=X.probabilities)
[1]  2 -4 -4 -4 -4 -4  2  5 -4  2
Of course, we could have replaced the $10$ above with whatever value or variable name representing the number of realizations we might desire.
Excel:
Simulating the same thing in Excel is a bit more complicated. What follows will use the SUM(), RAND(), and VLOOKUP() functions to this end -- but let us say a bit about each of these functions first:
$SUM(R)$ computes the sum of all cells in range $R$.
$RAND()$ produces a random real value $x$ where $0 \le x \lt 1$, and every such value is equally likely. (Note, we sometimes use the language of "randomly and uniformly picking some value $x$ with $0 \le x \lt 1$" to mean the same thing.)
While we won't need it for this particular application, one should also be aware of the closely related and time-saving function $RANDBETWEEN()$. Entering "$=RANDBETWEEN(a,b)$" in a cell will generate randomly and uniformly some value $x$ with $a \le x \le b$.
Importantly, certain actions in Excel (like entering a value in another cell) will trigger a recalculation of all formulas in the worksheet. As such, the value shown in a cell using either $RAND()$ or $RANDBETWEEN()$ in its formula may change when this happens. If desired, you can force one of these recalculations by hitting the F9 key.
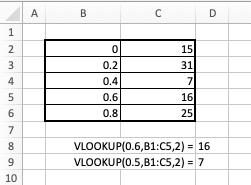
$VLOOKUP(x,R,c,m)$ finds the row in which $x$ appears in the first column of a range $R$ and returns the corresponding value in the $c^{th}$ column of that range. If the optional argument $m$ is TRUE (the default behavior), and $x$ is not in the first column of $R$, and the first column is sorted from least to greatest, then the row used will correspond to the last row where the element of the first column is still less than $x$.
Consider the following example:
Now, to simulate realizations of the random variable $X$ previously described, we use the following strategy:
Imagine partitioning the interval from $0$ to $1$ into pieces whose lengths are specified by the probabilities $P(x)$ in our table. (i.e., $P(-4) = 0.50, P(2) = 0.30, P(5) = 0.15, \textrm{ and } P(10) = 0.05$). This is illustrated in the diagram below, where each little block is $0.05$ long.
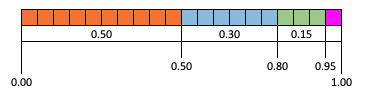
One might notice that these cutoffs can be calculated as cumulative sums of $P(X)$ values. That is to say:
$$\begin{array}{rcl} 0.50 &=& P(-4)\\ 0.80 &=& P(-4) + P(2)\\ 0.95 &=& P(-4) + P(2) + P(5)\\ 1.00 &=& P(-4) + P(2) + P(5) + P(10) \end{array}$$If one were to randomly (and uniformly) pick a value $r$ between 0 and 1 and mark it on the above diagram, it should be clear there would be:
We can calculate the cutoff values using the $SUM()$ function and then take advantage of these probabilities just mentioned by using the $RAND()$ and $VLOOKUP()$ functions to create our simulated realizations of $X$ values.
Note how this is done by considering the following example which creates 10 simulated realizations of the random variable $X$.
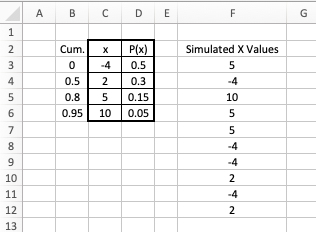
The following formulas are used in the above worksheet:
B4:"=SUM($D$3:$D3)"                (copied down to B6 to calculate the cutoff values)
F3:"=VLOOKUP(RAND(),$B$3:$D$6,2)"  (copied down to F12 to create 10 simulated values)
Upon entry of the probability mass function table in
C2:D6, the cutoff values are then calculated in column B (with the exception of the first 0, which is simply typed into cell B3.
Then, the values in column $B$ and the probability mass function table are treated as a single range of cells (i.e., B3:D6) and fed into the various $VLOOKUP()$ functions used in column $F$.
Each $VLOOKUP()$ application finds on the number line the first cutoff to the left of (i.e., "above" in the table) some random value in $[0,1)$, and returns the corresponding $x$ value from the second column (i.e., column $C$) as the simulated realization of $X$.