|
What characteristics must a normal probability distribution have to be a standard normal probability distribution?
Find the shaded area under each standard normal curve shown below:
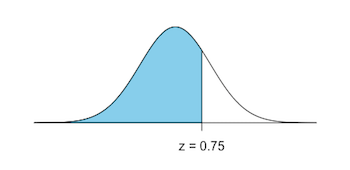
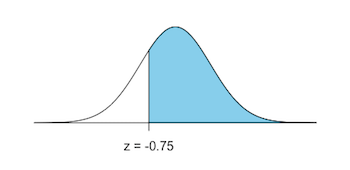
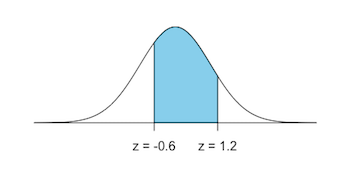
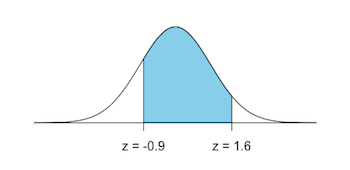
R:
a) pnorm(0.75)
b) 1-pnorm(-0.75)
c) pnorm(1.2)-pnorm(-0.6)
d) pnorm(1.6)-pnorm(-0.9)

Excel:
a) "=NORM.DIST(0.75,0,1,TRUE)"
b) "=1-NORM.DIST(-0.75,0,1,TRUE)"
c) "=NORM.DIST(1.2,0,1,TRUE)-NORM.DIST(-0.6,0,1,TRUE)"
d) "=NORM.DIST(1.6,0,1,TRUE)-NORM.DIST(-0.9,0,1,TRUE)"

TI-83:
a) normalcdf(-10^99,0.75)
b) normalcdf(-0.75,10^99)
c) normalcdf(-0.6,1.2)
d) normalcdf(-0.9,1.6)
Suppose temperature readings are normally distributed with mean $0^{\circ}$ and standard deviation $1^{\circ}$. Find the probabilities that a randomly selected temperature reading agrees with each of the following
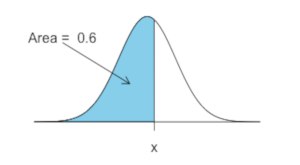
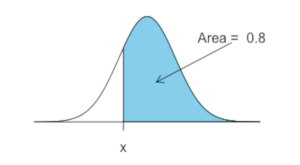
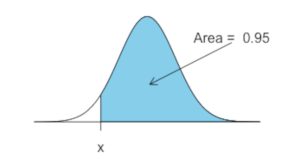
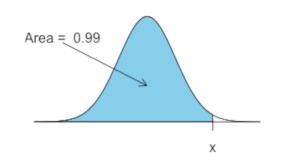
Find the $z$-score corresponding to the shaded area under each standard normal curve shown below:
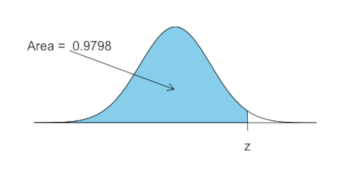
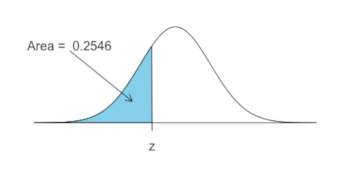
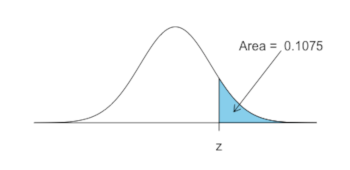
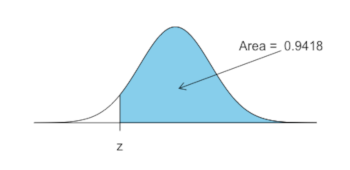
In R:
a) qnorm(0.9798)
b) qnorm(0.2546)
c) qnorm(1-0.1075)
d) qnorm(1-0.9418)

In Excel:
a) "=NORM.INV(0.9798,0,1)"
b) "=NORM.INV(0.2546,0,1)"
c) "=NORM.INV(1-0.1075,0,1)"
d) "=NORM.INV(1-0.9418,0,1)"

TI-83:
a) invNorm(0.9798)
b) invNorm(0.2546)
c) invNorm(1-0.1075)
d) invNorm(1-0.9418)
Find $P(z \lt 1.23)$, the area under the standard normal curve to the left of $z=1.23$
in R:
pnorm(1.23)

in Excel:
"=NORM.INV(1.23,0,1)"

TI-83:
invNorm(1.23)
Find $P(-0.67 \lt z \lt 0)$, the area under the standard normal curve between $z=-0.67$ and $z=0$.
Find each of the following probabilities
Find the number $b$ that satisfies:
Find $Q_1$, $Q_2$, and $Q_3$ on the standard normal distribution.
In R:
qnorm(c(0.25,0.50,0.75))

In Excel:
"=NORM.INV(0.25,0,1)"
"=NORM.INV(0.50,0,1)"
"=NORM.INV(0.75,0,1)"

TI-83:
invNorm(0.25)
invNorm(0.50)
invNorm(0.75)
Find the 90th percentile on the standard normal distribution.
In R:
qnorm(0.90)

In Excel:
"=NORM.INV(0.90,0,1)"

TI-83:
invNorm(0.90)
Find $P(-1 \lt z \lt 1)$ and $P(-2 \lt z \lt 2)$. Does your answer agree with the Empirical Rule?
In R:
pnorm(1)-pnorm(-1)
pnorm(2)-pnorm(-2)

In Excel:
"=NORM.DIST(1,0,1,TRUE)-NORM.DIST(-1,0,1,TRUE)"
"=NORM.DIST(2,0,1,TRUE)-NORM.DIST(-2,0,1,TRUE)"

TI-83:
normalcdf(-1,1)
normalcdf(-2,2)
Each normal curve below has mean $100$ and standard deviation $15$. Find each shaded area:
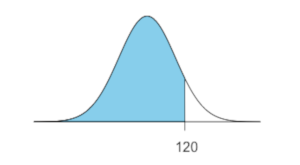
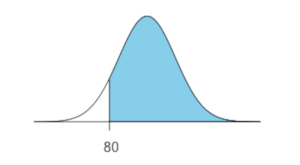
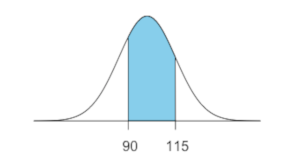
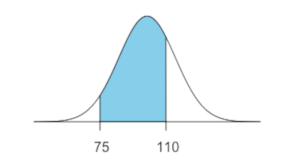
In R:
a) pnorm(120,mean=100,sd=15)
b) 1-pnorm(80,mean=100,sd=15)
c) pnorm(115,mean=100,sd=15)-pnorm(90,mean=100,sd=15)
d) pnorm(110,mean=100,sd=15)-pnorm(75,mean=100,sd=15)

In Excel:
a) "=NORM.DIST(120,100,15,TRUE)"
b) "=1-NORM.DIST(80,100,15,TRUE)"
c) "=NORM.DIST(115,100,15,TRUE)-NORM.DIST(90,100,15,TRUE)"
d) "=NORM.DIST(110,100,15,TRUE)-NORM.DIST(75,100,15,TRUE)"

TI-83:
a) normalcdf(-10^99,120,100,15)
b) normalcdf(80,10^99,100,15)
c) normalcdf(90,115,100,15)
d) normalcdf(75,110,100,15)
In each normal distribution below, all of which have mean $100$ and standard deviation $15$, find the indicated value of $x$:
In R:
a) qnorm(0.6,mean=100,sd=15)
b) qnorm(1-0.8,mean=100,sd=15)
c) qnorm(1-0.95,mean=100,sd=15)
d) qnorm(0.99,mean=100,sd=15)

In Excel:
a) "=NORM.INV(0.6,100,15)"
b) "=NORM.INV(1-0.8,100,15)"
c) "=NORM.INV(1-0.95,100,15)"
d) "=NORM.INV(0.99,100,15)"

TI-83:
a) invNorm(0.6,100,15)
b) invNorm(1-0.8,100,15)
c) invNorm(1-0.95,100,15)
d) invNorm(0.99,100,15)
The average salary for first-year teachers is $\$27,989$. Assume the distribution is approximately normal with standard deviation $\$3250$.
What is the probability that a randomly selected first-year teacher makes between $\$20,000$ and $\$30,000$ each year?
What is the probability that a randomly selected first-year teacher has a salary less than $\$20,000$?
$\mu = 27989$ and $\sigma = 3250$. Finding $z_{20000} = (20000 - 27989)/3250 = -2.4582$, and $z_{30000} = (30000 - 27989)/3250 = 0.6188$, we calculate $P(20000 \lt x \lt 30000)$ as $P(-2.4581 \lt z \lt 0.6188) = 0.7250$.
Using the calculations from part (a), we have $P(x \lt 20000) = P(z \lt -2.4582) = 0.0070$.
The national average SAT score is 1019. Assume SAT scores follow a normal distribution with standard deviation 90.
What is the probability that a randomly selected score exceeds 1200?
What is the 90th percentile score?
$\mu = 1019$ and $\sigma = 90$. Finding $z_{1200} = (1200 - 1019)/90 = 2.011$, we calculate $P(x \gt 1200)$ as $P(z \gt 2.011) = 1 - P(z \lt 2.011) = 0.0222$
The area left of $z = 1.282$ is $0.90$, so the $90$th percentile score is $1019 + (1.282)(90) = 1134$.
The average time a person spends at the Barefoot Landing Seaquarium is 96 minutes. The standard deviation is 17 minutes. Assume the variable is normally distributed.
If a visitor is selected at random, find the probability that he or she will spend at least 120 minutes at the seaquarium.
If a visitor is selected at random, find the probability that he or she will spend at most 80 minutes at the sequarium.
Suggest a time for a bus to return to pick up a group of tourists
$0.0790$
$0.1733$
$3$ standard deviations away from the mean will catch almost all of the tourists, by the empirical rule, so pick them up $96+(3)(17) = 147$ minutes after dropping them off at the Barefoot Landing Seaquarium.
The average charitable contribution itemized per income tax return in Pennsylvania is $\$792$. Suppose that the distribution of contributions is normal with a standard deviation of $\$103$. Find the limits for the middle 50% of contributions.
Test scores for a given class are normally distributed with a mean of 80 and standard deviation of 12, with several over 100 (with bonus points). Find the probability that a randomly selected student from this class has a test score that is...
less than 92
between 80 and 90
greater than 70
Test scores for a given class are normally distributed with a mean of 80 and standard deviation of 12, with several over 100 (with bonus points).
Find the test score that separates the bottom $30\%$ from the top $70\%$
If a student scores in the top $10\%$ of all test scores, her test score is at least what?
What range of test scores constitutes the middle $50\%$?
Men's heights are normally distributed with a mean of $69.0$ inches and a standard deviation of $2.8$ inches, while women's heights are normally distributed with a mean of $63.6$ inches and a standard deviation of $2.5$ inches.
What percentage of men must duck when walking through a door that is $72$ inches high?
What percentage of women must duck when walking through a door that is $72$ inches high?
What door height would allow at least 95% of men to walk through the door without ducking?
Most people think normal body temperature is $98.6^{\circ}$ F. In 1992, the Journal of the American Medical Association asserted that a more accurate figure may be $98.2^{\circ}$ F, and that body temperatures had a standard deviation of $0.7^{\circ}$ F. Assuming this is true and body temperatures follow a normal distribution, answer the following:
In what interval does the "middle 90%" of body temperatures fall?
What fraction of people would be expected to have a body temperature above $98.6^{\circ}$ F?
Below what body temperature are the coolest $20\%$ of all people?
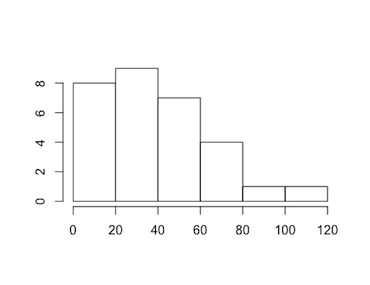
Is the following data set normal?
3, 58, 5, 65, 17, 48, 52, 75, 21, 76, 58, 36,
100, 111, 34, 41, 23, 44, 33, 50, 13, 18, 7,
12, 20, 24, 66, 28, 28, 31
The histogram for the data (shown below) is unimodal, but appears skewed (although notably, it is not significantly so as $I = 0.7064 \lt 1$).