|
Consider the following data set,
171, 186, 191, 204, 235, 173, 186, 193, 204, 239, 174, 186, 197, 209, 240,
181, 187, 199, 210, 242, 182, 188, 200, 211, 243, 184, 191, 200, 218, 320
What is the relative frequency of integers contained in the interval $[171,320]$?
For a frequency distribution for the data above, with 8 classes, find the smallest integer that can be used for the class width.
Construct a frequency distribution with 8 classes, indicating both the class limits and class boundaries. Note, end classes may not be empty. Choose "nice" numbers, to the extent possible.
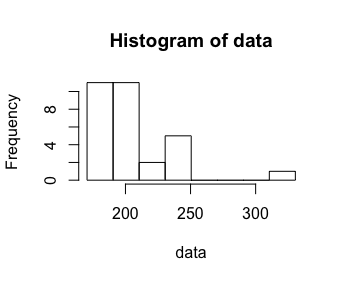
Construct the histogram that corresponds to frequency distribution constructed in part (c) for this data
For each integer that occurs in the data set, find the number of times it occurs divided by the number of values in the data set. So for example, 186 appears 3 times, and thus has relative frequency of $3/30 = 0.10$.
Note, one can do the counting just suggested by hand -- or much more quickly using the table(data) function in R, which prints how often each value in the vector data occurred.
> data = c(171, 186, 191, 204, 235, 173, 186, 193, 204, 239, 174, 186,
197, 209, 240, 181, 187, 199, 210, 242, 182, 188, 200, 211, 243,
184, 191, 200, 218, 320)

> table(data)
data
171 173 174 181 182 184 186 187 188 191 193 197 199 200
  1   1   1   1   1   1   3   1   1   2   1   1   1   2
204 209 210 211 218 235 239 240 242 243 320
  2   1   1   1   1   1   1   1   1   1   1
$19$
Limits        Boundaries        Frequency
171 - 190     170.5 - 190.5     11
191 - 210     190.5 - 210.5     11
211 - 230     210.5 - 230.5     2
231 - 250     230.5 - 250.5     5
251 - 270     250.5 - 270.5     0
271 - 291     270.5 - 290.5     0
291 - 310     290.5 - 310.5     0
311 - 330     310.5 - 330.5     1
We can use R to create this histogram quickly with the following:
hist(data,breaks=seq(from=170.5,to=330.5,by=20))
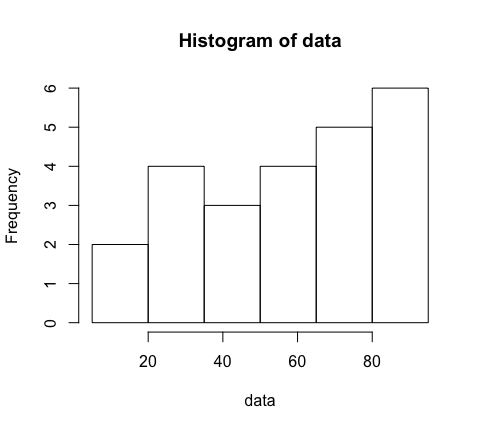
Construct a frequency distribution and histogram for the following data set. Use 6 classes.
8, 37, 88, 68, 77, 80, 86, 50, 92, 59, 37, 15, 70, 33, 72, 46, 65,
34, 86, 32, 56, 53, 30, 94
Limits        Boundaries        Frequency
5-19          4.5 - 19.5        2
20-34         19.5 - 34.5       4
35-49         34.5 - 49.5       2
50-64         49.5 - 64.5       4
65-79         64.5 - 79.5       5
80-95         79.5 - 95.5       6
Note, you can count the frequency of each value by hand, or you can use R to do this after making a histogram -- as seen below:
data = c(8, 37, 88, 68, 77, 80, 86, 50, 92, 59, 37, 15, 70, 33, 72, 46, 65,
         34, 86, 32, 56, 53, 30, 94)

h = hist(data,breaks=seq(from=4.5,to=95.5,by=15))
h$counts
[1] 2 4 3 4 5 6