
|
As the below graphic suggests -- given some binomial distribution, a normal curve with the same mean and standard deviation (i.e., $\mu = np$, $\sigma=\sqrt{npq}$) can often do a great job at approximating the binomial distribution. When this is the case, we can use the normal curve to estimate the various probabilities associated with that binomial distribution.
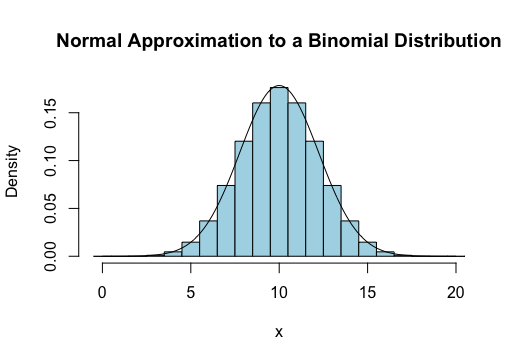
For example, $P_{\textrm{binomial}}(5 \lt x \lt 10)$ can be approximated by $P_{\textrm{normal}}(5.5 \lt x \lt 9.5)$.
Similarly, $P_{\textrm{binomial}}(10)$ can be approximated by $P_{\textrm{normal}}(9.5 \lt x \lt 10.5)$.
To see why we add or subtract $0.5$ to some of the values involved, consider the last example and the rectangle in the histogram centered at $x=10$. This rectangle has height given by $P(10)$. It also has a width of $1$. Thus, this rectangle has an area of $P(10)$ as well. Consequently, we can approximate $P(10)$ with anything that approximates the area of that rectangle, which the strip between $9.5$ and $10.5$ on the normal curve does quite handily. Adding or subtracting $0.5$ in this way from the values involved in the associated binomial probability is called a continuity correction. This is a necessary modification one must make when using a continuous distribution to approximate a discrete distribution.
Importantly, there are also times when a normal curve will NOT approximate a given binomial distribution well. To ensure the probabilities given by the normal curve match well the probabilities present in the binomial distribution, we must ensure that the expected number of "successes" and the expected number of "failures" are both "large enough". What exactly constitutes "large enough" varies depending on what textbook you read, but the choice is not completely arbitrary. Recalling that the expected number of "successes" and "failures" are given by $np$ and $nq$, respectively, we argue here that we can approximate a binomial distribution with a normal distribution only if
$$np \ge 5 \quad \textrm{ and } \quad nq \ge 5$$In the above graphic, the binomial distribution shown resulted from $n=20$ trials with probability of success $p=0.50$. In this case, $np = nq = 10 \ge 5$, and we can see the approximation is a good one.
To see a case where the binomial distribution is not well approximated by a normal curve, consider the binomial distribution with $n=6$ trials and $p=1/4$, as shown below
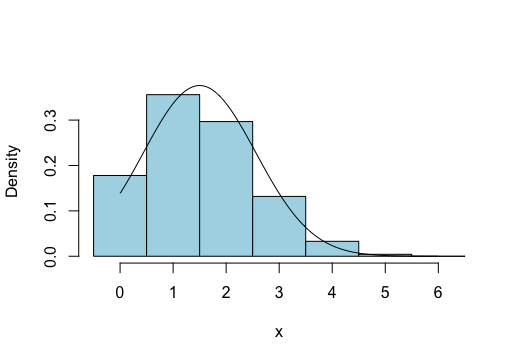
While the curve still follows the heights of the rectangles fairly well, the critical thing to notice is that a big chunk of the normal curve (the majority of its left tail) is not accounted for at all by the rectangles drawn for the binomial distribution. This happens because the normal distribution has a significant portion of its distribution associated with negative values. The binomial distribution, on the other hand, is concerned with a count of successes seen -- values which are never negative.
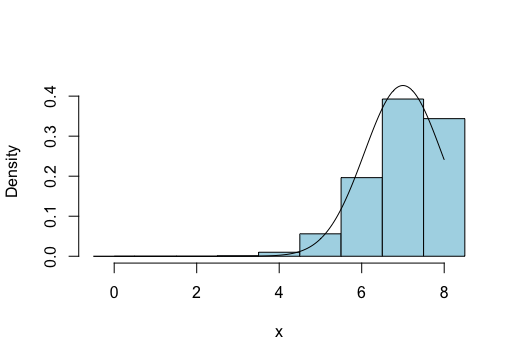
In a similar manner, it can happen that the related normal distribution extends past $x=n$, while a binomial distribution associated with $n$ trials can never consider a number of successes greater than $n$. An example of this is shown below. This one has $n=8$, $p=7/8$, which leads to $nq = 1 \lt 5$.
Now, let's make sense of the algebra behind all of this...
Given some Binomial distribution with mean, $\mu$, and standard deviation, $\sigma$, suppose we find the Normal curve with these same parameters.
In order to do a good job of approximating the binomial distribution, the Normal curve must have the bulk of its own distribution between legitimate outcomes for the Binomial distribution.
That is to say, if our Binomial distribution is based on $n$ trials, the bulk of the Normal distribution had better lie somewhere between 0 and $n$.
By "bulk of the Normal distribution", let us be more precise and say "the central 95% of the Normal distribution".
We know, by the empirical rule, that the central 95% of any Normal distribution lies within two standard deviations of its mean.
So keeping this region between 0 and $n$ translates into:
$$\mu - 2\sigma \gt 0 \quad \textrm{ and } \quad \mu + 2\sigma \lt n$$Recalling that the mean of a Binomial distribution is given by $\mu = np$ and its standard deviation is given by $\sigma = \sqrt{npq}$, we may rewrite these two inequalities as
$$np - 2\sqrt{npq} \gt 0 \quad \textrm{ and } \quad np + 2\sqrt{npq} \lt n$$Let us focus on the first inequality for a moment. First, let us take the square root to the other side,
$$np \gt 2 \sqrt{npq}$$and then we square both sides so that the radical disappears
$$n^2p^2 \gt 4npq$$We now notice a common factor of $np$ on both sides, which can be canceled off
$$np \gt 4q$$Then remembering that $q=1-p$, we make an appropriate substitution
$$np > 4(1-p)$$And finally, multiplying things out, we get
$$np > 4 - 4p$$Remember, this inequality is a necessary condition for a Normal curve to do a good job at approximating a Binomial distribution.
Given that the probability of success, $p$, must (by virtue of being a probability) stay between 0 and 1, as long as we ensure that $np$ is 5 or more, this condition gets satisfied!
That's half of the story -- now what about that other inequality...
Let's see, it said that the other condition for a Normal curve to do a good job at approximating a Binomial distribution was
$$np+2\sqrt{npq}\lt n$$which is equivalent to
$$2\sqrt{npq} \lt n - np$$We may factor out an $n$ on the right, to get
$$2\sqrt{npq} \lt n(1-p)$$But then, we notice that $1-p=q$, so we may rewrite things as
$$2\sqrt{npq} \lt nq$$Now we may argue similar to before, starting with squaring both sides,
$$4npq \lt n^2 q^2$$dividing both sides by $nq$,
$$4p \lt nq$$rewriting $p$ in terms of $q$
$$4(1-q) \lt nq$$and finally, multiplying things out
$$4 - 4q \lt nq$$Here again, this is a necessary condition to be met if the Normal curve is to do a good job at approximating a Binomial distribution.
So, as before, if we ensure that $nq \gt 5$, then our condition is satisfied (remember, $q$ must be bound between 0 and 1 as well).
In summary, as long as we ensure that
$$np \ge 5 \quad \textrm{ and } \quad nq \ge 5$$then we may rest assured that the Normal curve will do a very good job at approximating a Binomial distribution.