|
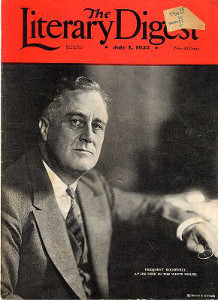
In 1936, Literary Digest, a national magazine of the time, sent out 10 million "straw" ballots asking people to tell them who they planned on voting for in the 1936 presidential election. They received back 2.4 million ballots (not bad for a pre-internet time when polling was still in its infancy, but still only about a 25% return rate, which leaves the door open for voluntary response bias). They predicted Alf Landon would beat Franklin Delanor Roosevelt 57% to 43%. As it turned out, Roosevelt won 62% to 37%.
There were two large problems:
First, the sample chosen was not representative of voters. Literary Digest used lists of phone numbers, drivers' registrations, and country club memberships to select its sample. But 1936 was the height of the depression. At that time, phones, cars, and country clubs were more often available only to rich. The economy was the central campaign issue of the election with Roosevelt advocating the New Deal that was attractive to lower income people, so the opinions of the rich and poor were bound to differ on this issue. As such, their sample turned out to be incredibly biased, and ultimately, useless.
The second problem with the Literary Digest poll was that out of the 10 million people whose names were on the original mailing list, only about 2.4 million responded to the survey. Thus, the size of the sample was about one-fourth of what was originally intended. People who respond to surveys are different from people who don't, not only in the obvious way (their attitude toward surveys) but also in more subtle and significant ways. When the response rate is low (as it was in this case, 0.24), a survey is said to suffer from nonresponse bias. This is a special type of selection bias where reluctant and nonresponsive people are excluded from the sample.
The Literary Digest "lost face" and later went out of business.
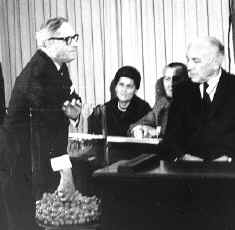
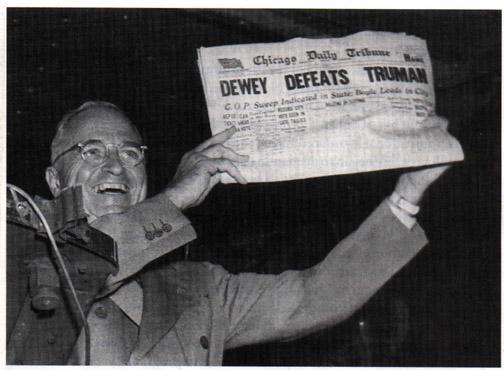
In the 1948 presidential election, Thomas Dewey, then governor of New York, ran against the incumbent, Harry S. Truman. Three major polls (Gallup included) predicted Dewey would win. He did not. The Gallup poll came closest with 49.5% Dewey, 44.5% Truman, 5.5% other, and 0.5% undecided.
There were several problems:
First, they stopped polling too soon, and Truman was notably successful at energizing people in the last days before the election. The prediction came two weeks in advance of the election with 15% announcing undecided. It was assumed that the 15% undecided would split in the same proportions as those who had decided, leaving only 0.5% truly undecided. (The 0.5% undecided was Gallup's error factor.)
Second, the telephone polls tended to favor Dewey because in 1948 telephones were generally limited to more well-to-do households, and Truman was less popular among elite voters.
Third, one of the methods used sent interviewers into an area and told them to interview a certain number of people who met some given demographic criteria. For example, a pollster might be told to choose and interview 10 men, 11 women, 8 african americans, 2 asians, and 11 caucasians, etc... where the numbers chosen for each demographic is representative of the overall population.
Unfortunately for the pollsters, just because a sample is representative of the population demographically, doesn't mean that it will be representative with regard to the issue at hand.
Even worse, as long as the pollsters matched the quotas for their demographics, they were free to choose whom they like -- which can lead to substantial bias in the sample when pollsters avoid certain people that for some reason are hard to approach.
The days of the year, from 1 to 366, were written on slips of paper and the slips were placed in plastic capsules. The capsules for each month, starting with January and ending with December, were mixed in a shoebox and then they were dumped into a deep glass container. Capsules were then drawn from the jar one at a time.
The first number drawn was 258 (which corresponds to September 14). Men of draft age (those born between 1944 and 1950) whose birthday was Sept. 14 would then constitute the first group to be drafted. The second group of men to be drafted corresponded to birthdays agreeing with the second capsule/number drawn, and so on.
It was quickly noticed that men with birthdays in December seemed to get drafter earlier, on average, than birthdays in other months. With hindsight being 20/20, it's easy to see how this happened. The capsules were put into the jar month by month. So January capsules probably stayed on the bottom of the jar, while February capsules were on top of them, and so on, until December capsules ended up on top. Whatever subsequent mixing efforts were taken was not sufficient to completely overcome this ordering, producing a sample biased toward later months in the year.