
|
To clearly and precisely define what one means by an "event" in discussions related to probability, we'll need some additional vocabulary first:
A random experiment is a chance process that leads to well-defined results called outcomes that can be described prior to its performance. As examples, both flipping a coin and rolling a die would be random experiments.
A simple event is an outcome of a single trial of a random experiment. For the previous examples, a simple event might be seeing "heads" on a particular flip or be the number showing on a rolled die.
The sample space for a random experiment is the set of all possible simple events with which it is associated. So for the flip of a coin, the sample space might be represented by the set $S = \{H, T\}$ where $H$ corresponds to seeing "heads" and $T$ corresponds to seeing "tails". For the roll of a standard die, we would likewise have a sample space of $S = \{1,2,3,4,5,6\}$. If two dice are rolled, the sample space would consist of all 36 possible ordered pairs: $(1,1),\ldots,(1,6),(2,1),\ldots,(2,6),\ldots,(6,6)$. Note, this set can be conveniently described using a table: $$\begin{array}{c|c|c|c|c|c|c} & 1 & 2 & 3 & 4 & 5 & 6\\\hline 1 & (1,1) & (1,2) & (1,3) & (1,4) & (1,5) & (1,6)\\\hline 2 & (2,1) & (2,2) & (2,3) & (2,4) & (2,5) & (2,6)\\\hline 3 & (3,1) & (3,2) & (3,3) & (3,4) & (3,5) & (3,6)\\\hline 4 & (4,1) & (4,2) & (4,3) & (4,4) & (4,5) & (4,6)\\\hline 5 & (5,1) & (5,2) & (5,3) & (5,4) & (5,5) & (5,6)\\\hline 6 & (6,1) & (6,2) & (6,3) & (6,4) & (6,5) & (6,6)\\\hline \end{array}$$
Finally, an event is a subset of the sample space. Every simple event is certainly an event, but events can be compound in nature as well. For example, one can consider the event of rolling an even number. The related subset of $S$ is then $E = \{2,4,6\}$. Similarly, the event of rolling two dice and seeing only 1's or 2's on each individual die could be described by the cells marked in blue below, while the event of rolling two dice and getting a 2,3,4, or 5 on the first die, and a 4 or 5 on the second die, could be described by the cells marked in red below.: $$\require{color}$$ $$\begin{array}{c|c|c|c|c|c|c} & 1 & 2 & 3 & 4 & 5 & 6\\\hline 1 & {\color{blue}\fbox{(1,1)}} & {\color{blue}\fbox{(1,2)}} & (1,3) & (1,4) & (1,5) & (1,6)\\\hline 2 & {\color{blue}\fbox{(2,1)}} & {\color{blue}\fbox{(2,2)}} & (2,3) & {\color{red}\fbox{(2,4)}} & {\color{red}\fbox{(2,5)}} & (2,6)\\\hline 3 & (3,1) & (3,2) & (3,3) & {\color{red}\fbox{(3,4)}} & {\color{red}\fbox{(3,5)}} & (3,6)\\\hline 4 & (4,1) & (4,2) & (4,3) & {\color{red}\fbox{(4,4)}} & {\color{red}\fbox{(4,5)}} & (4,6)\\\hline 5 & (5,1) & (5,2) & (5,3) & {\color{red}\fbox{(5,4)}} & {\color{red}\fbox{(5,5)}} & (5,6)\\\hline 6 & (6,1) & (6,2) & (6,3) & (6,4) & (6,5) & (6,6)\\\hline \end{array}$$ Note, in the above example, the individual outcomes that made up each of the events described were "clustered together" in the sample space. This certainly need not always be the case -- consider the event of rolling either "snake eyes" or "box cars" -- i.e., rolling two ones or two sixes, respectively. However, the "blobs" of red and blue in the above table suggest a useful way to envision a set...
Suppose we represent the sample space for a particular random experiment by a rectangular region, and events as "blobs" (often circular or elliptical, but not always so) contained within this region. It should not be hard to see that if we refer to the event associated with the blue cells in the table above as event A, and the event associated with the red cells in the same table as event B, we might end up with a picture like the following.
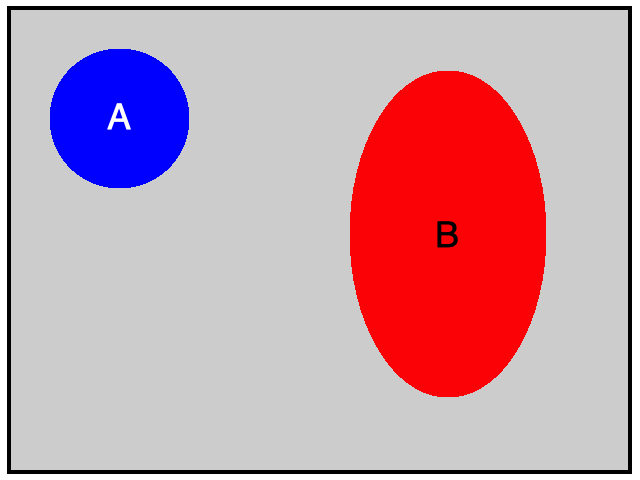
The events $A$ and $B$ shown above certainly appear to share no common possible outcomes. Note, when sets have no elements in common, they are said to be disjoint.
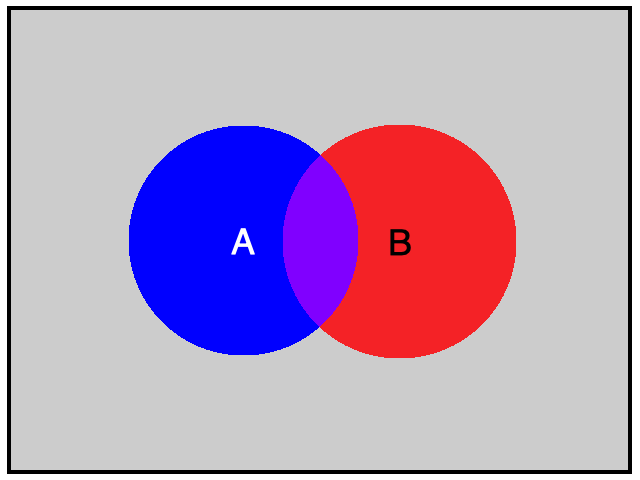
In general, however, this certainly doesn't have to be the case. Just consider the event $C$ of rolling a sum that is at most a 4 and the event $D$ of rolling a three or greater on at least one die. In this case, $(1,3)$ and $(3,1)$ are possible outcomes for both events.
As such, to visually suggest the possibility for common outcomes when they are present, we often draw our event "blobs" so that they overlap, as shown below:

Pictures like the one above that depict sets and their possible overlaps in this way are called Venn Diagrams.
A common theme in mathematics is how to build new things from known things. Consider the simple functions $f(x) = x^3$ and $g(x) = \sin x$. We can build a new function from the first by finding its inverse, $f^{-1}(x) = \sqrt[3]{x}$. Alternatively, we can combine both of the functions given to build new functions by considering their sum: $(f+g)(x) = x^3 + \sin x$, their product: $(fg)(x) = x^3\sin x$, their composition: $(f \circ g)(x) = \sin^3 x$, etc..
We can do the same thing with events. As perhaps the simplest example, consider an event $A$ in some sample space $S$. Recall that $A$ is really just a subset of the possible outcomes that comprise $S$, and we say that event $A$ has occurred if any of these outcomes occur. But then, it is easy to describe another event, called the complement of $A$, and denoted by $\overline{A}$, that occurs precisely when $A$ doesn't occur. That is to say, $\overline{A}$ is the subset of outcomes in $S$ that are not in $A$.
To provide a couple of examples for context:
Visually, the animation below suggests the relationship between $A$ and $\overline{A}$:
There are a couple of useful ways to combine two events as well. Given two events $A$ and $B$, we could define the event that consists of all outcomes that are in either A or B (or both). As the following animation suggests, this is called the union of $A$ and $B$ and is denoted by either $A \cup B$, or equivalently by $A \textrm{ or } B$:

In a similar vein, given two events $A$ and $B$, we could define the event that consists of all outcomes in both $A$ and $B$. As again suggested by the animation below, this is called the intersection of $A$ and $B$ and is denoted by $A \cap B$, or equivalently $A \textrm{ and } B$:
Lastly, an event that contains no outcomes of a given sample space, sometimes called a null event, is appropriately denoted by the symbol for a set with no elements -- the empty set, $\varnothing$. So for example, the intersection of two disjoint events is $\varnothing$.