
|
When estimating $\mu$ with $\overline{x}$, it was a natural question to ask how are all the possible $\overline{x}$ values one could ever see distributed. The central limit theorem, of course, provided the answer -- at least when the population is normal, these $\overline{x}$ values are normally distributed, with a mean identical to the population mean and a standard deviation smaller by a factor of $\sqrt{n}$.
One might then wonder, when estimating $\sigma^2$ with $s^2$ (at least for a normal population), how are all the possible $s^2$ values one could ever see distributed?
Towards this end, suppose one knows the mean $\mu$ for a normal population and estimates $\sigma^2$ from a sample of $x_1, x_2, \ldots, x_n$ with $$s_0^2 = \frac{\sum_{i=1}^{n} (x_i - \mu)^2}{n}$$ Note, we divide by $n$ and not $(n-1)$ in the above because we use the known $\mu$ instead of its estimate $\overline{x}$ (See Bessel's Correction).
Now consider the following:
$$\frac{s_0^2}{\sigma^2} = \frac{1}{\sigma^2} \frac{\sum_{i=1}^{n} (x_i - \mu)^2}{n} = \frac{1}{n} \sum_{i=1}^n \left(\frac{x_i-\mu}{\sigma}\right)^2$$Of course, when $x_i$ follows a normal population, $z_i = (x_i - \mu)/\sigma$ will follow a standard normal distribution. Making this substitution, we have
$$\frac{s_0^2}{\sigma^2} = \frac{1}{n} \sum_{i=1}^n z_i^2$$The distribution of $s_0^2$ is clearly governed by the distribution of the sum on the right side (that's where all of the randomness resides). Consequently, we give such a distribution of sums of some number of squared values from a normal distribution a name...
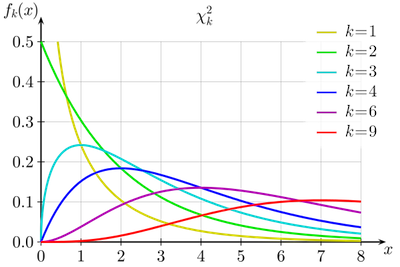
The sum of squares of a set of $k$ independent random variables each following a standard normal distribution is said to follow a chi square distribution with $k$ degrees of freedom, denoted by $\chi_k^2$:
$$\chi_{k}^2 = \sum_{i=1}^k z_i^2$$The below graphic shows some chi square distributions for some small values of $k$:
Returning to our earlier problem of understanding the distribution of sample variances, recall that in the computation of $s^2$ one uses $\overline{x}$ instead of a known $\mu$, and divides by $(n-1)$ instead of $n$.
$$s^2 = \frac{\sum_{i=1}^n (x_i - \overline{x})^2}{n-1}$$Consequently, the sum of squared deviations $z_i^* = (x_i - \overline{x})/\sigma$ becomes smaller, but in just such a way that
$$\sum_{i=1}^n (z_i^*)^2 \sim \chi_{n-1}^2$$ Justification for this last claim is not immediately obvious (not unlike the previously encountered Bessel's correction). However, the result is that now, rather than having $$\frac{ns_0^2}{\sigma^2} \sim \chi_n^2$$ when we take into account the smaller deviations due to using $\overline{x}$ instead of $\mu$ and dividing by $(n-1)$ instead of $n$ to best approximate the variance, we get a chi-square distribution related to more familiar statistics: $$\frac{(n-1)s^2}{\sigma^2} \sim \chi_{n-1}^2$$ Of course, when the population in question follows a standard normal distribution (where $\sigma = 1$), the chi square distribution is approximated by something even more simply described: $$(n-1)s^2 \sim \chi_{n-1}^2$$