
|
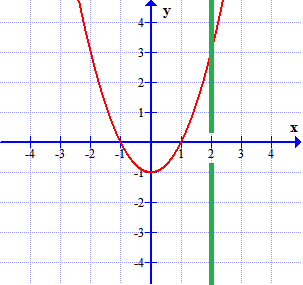
Looking at the graph above, notice that part of the function graphed has been covered up by a green strip. This strip hides the height of the function at $x=2$, or equivalently, the value of $f(2)$. However, given what you can still see, what is your expectation for the height of the function at $x=2$? If you are like most folks, you expect that $f(2)=3$. We all presume this under an assumption that the function near this point should be able to be drawn with one continuous stroke of a pen.
This need not be the case, however -- the reality of the situation could agree with our expectation, or it could be quite different. Consider the following graphs:
|
Graph A 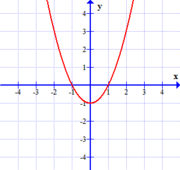 $$f(x)=x^2-1$$ |
Graph B 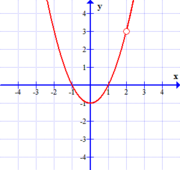 $$f(x) = {(x^2-1)(x-2) \over x-2}$$ |
Graph C 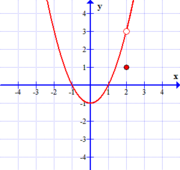 $$f(x) = \left\{ \begin{array}{cl} x^2-1 &\textrm{if } x \neq 2\\ 1 & \textrm{if } x = 2 \end{array} \right.$$ |
As suggested by the above, there are three different possibilities:
The value of $f(2)$ agrees with our "expectation" (graph A); graphically, we say $(2,3)$ is a point of continuity when this happens.
The value of $f(2)$ doesn't even exist. That is to say, $x=2$ is not even in the domain of $f(x)$, so our expectation is not met (graph B); graphically, in this situation, we say there is a hole at $(2,3)$ in the graph of $y=f(x)$.
The value of $f(2)$ does exist, but disagrees with our expectation (graph C); graphically, we say that we have a hole at $(2,3)$ and an isolated point at $(2,1)$.
So we can see that the notion of this "expected value" for a function at a particular $x$-value is completely independent of the actual value of $f(x)$ at that same $x$-value. We call this "expected value" for a function at $x=c$ the limit of $f(x)$ as $x$ approaches $c$, and we denote it by
$$\lim_{x \rightarrow c} \,\, f(x)$$In all of the example functions shown above, we could then say...
$$\lim_{x \rightarrow 2} \,\, f(x) = 3$$Interestingly -- sometimes, at certain places in some functions, we can't form a common expectation for what the height of the function should be at $x=c$, when the behavior there is hidden from us. In these cases, we say the limiting value does not exist. The reasons for not being able to form an expected value for $f(x)$ at some $x$-value vary. The following graphs suggest some primary ways in which this might happen:
|
Graph D 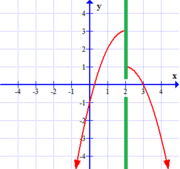 $$y=f(x), \qquad c=2$$ |
Graph E 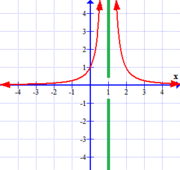 $$y=g(x), \qquad c=1$$ |
Graph F 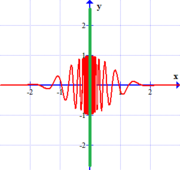 $$y=h(x), \qquad c=0$$ |
Let us take a look at each of the graphs above showing limits that fail to exist in turn, and their implications...
a gap (or jump) discontinuity
Some side notes:
We denote these separate expectations coming from the behavior of the function to the left and right of $x=c$ as one-sided limits.
These one-sided limits have their own notation as well. We denote the limit of $f(x)$ as $x$ approaches $c$ from the left by $$\lim_{x \rightarrow c^-} f(x)$$ Similarly, we denote the limit of $f(x)$ as $x$ approaches $c$ from the right by $$\lim_{x \rightarrow c^+} f(x)$$ Specifically, with regard to graph D, even though $\lim_{x \rightarrow 2} \,\, f(x)$ does not exist, we can still say $$\lim_{x \rightarrow 2^-} f(x) = 3 \quad \textrm{and} \quad \lim_{x \rightarrow 2^+} f(x) = 1$$
Graphically, when $\lim_{x \rightarrow c^-} f(x)$ and $\lim_{x \rightarrow c^+} f(x)$ both exist, but disagree in value, we say the function has a gap, or jump discontinuity at $x=c$.
a vertical asymptote
Some side notes:
Note that we might be tempted to write $\lim_{x \rightarrow 1} g(x) = +\infty$ to describe what it is that we DO expect, and ultimately we will indeed write this, calling such things infinite limits -- however, we must acknowledge that technically, such limits still do not exist.
Also, this type of situation can just as easily happen if the function "flies off to negative infinity", decreasing without bound as $x$ approaches the value in question. For that matter, it could be the case that the function "flies off to" positive infinity on one side of the $x$-value in question, and negative infinity on the other. These cases are handled in similar ways. In each, we say the limit technically does not exist, although the notation we use to describe the situation may look like it suggests something else. For example, for some appropriate function $f(x)$, we might see $\lim_{x \rightarrow c} f(x) = -\infty$ or $\lim_{x \rightarrow c^+} f(x) = +\infty$. Just remember, $\infty$ is not a value.
Graphically, if we have an infinite limit (one-sided or two-sided) associated with some $x=c$, we necessarily have a vertical asymptote there.
infinite (undamped) oscillations