
|
Some of the exercises below provide sample runs to better clarify what the program in question is supposed to do. In these sample runs, text given in green has been typed by the user, while white text has been output by the program. Additionally, the "$" symbol indicates the command prompt, while the "↵" symbol indicates the user has pressed the return key.
Exercises identified with a breadboard logo ![]() (shown at left) require the following library:
(shown at left) require the following library:
breadboards.jar.
Write a method sumDigits(long n) that computes the sum of the digits of a given (long) number.
public static int sumDigits(long n) {
    int sum = 0;
    while (n > 0) {
      sum += n % 10;
      n /= 10;
    }
    return sum;
  }
Twin primes are a pair of prime numbers that differ by 2. For example, 3 and 5 are twin primes, 5 and 7 are twin primes, and 11 and 13 are twin primes. Write a class TwinPrimes to find all twin primes less than some integer $n$, supplied by the user. Include and use a method isPrime(int n) to this end.
$ java TwinPrimes↵
Enter n: 50↵
(3, 5)
(5, 7)
(11, 13)
(17, 19)
(29, 31)
(41, 43)
import java.util.Scanner;

public class TwinPrimes {

  public static boolean isPrime(int n) {
    for (int d = 2; d < Math.sqrt(n)+1; d++) {
      if (n % d == 0) {
        return(false);
      }
    }
    return (true);
  }

  public static void main(String[] args) {
    System.out.print("Enter n: ");
    Scanner scanner = new Scanner(System.in);
    int n = scanner.nextInt();
    scanner.close();

    for (int i = 2; i <= n; i++) {
      if (isPrime(i) && isPrime(i+2)) {
        System.out.println("("+i+", "+(i+2)+")");
      }
    }
  }
}
Write a class PointsToAngles that prompts the user to enter three points of a triangle and displays the angles of that triangle in degrees. Round the values to keep two digits past the decimal point.
Assuming point $A$ has coordinates $(a_x,a_y)$, point $B$ has coordinates $(b_x,b_y)$ and point $C$ has coordinates $(c_x,c_y)$, you may find it useful to create a method angle(double ax, double ay, double bx, double by, double cx, double cy) that returns the measure of the angle $\angle ABC$, in degrees.
You will find it useful to know that if the length of the sides opposite angles $A$, $B$, and $C$ are $a$, $b$, and $c$, respectively:
$$m\angle ABC = \cos^{-1} \left( \frac{b^2 - a^2 - c^2}{-2ac} \right)$$A sample run is shown below
$ java PointsToAngles↵
Enter the coordinates of three points, separated by spaces: 1 1 6.5 1 6.5 2.5↵
The three angles are 15.26 90.0 74.74
![]() Write a class
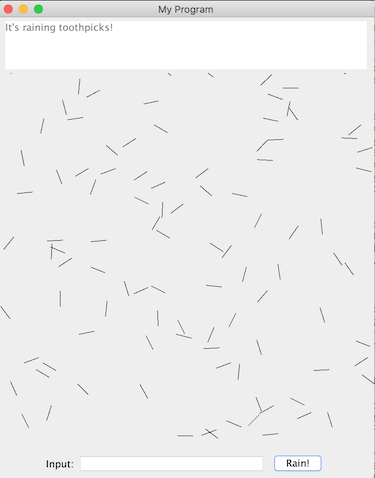
Write a class ToothpickRain that extends the Breadboard class; displays "It's raining toothpicks!" in the text area; and upon a user click of the single button labeled "Rain!" on the breadboard window, proceeds to add rotating GLine objects 20 pixels long just above the visible portion of the central drawing panel (i.e., the initial y-coordinates of these GLine objects should be negative).
These GLine objects should continue to rotate while also falling towards the bottom of the window. Once they are fully past the bottom visible portion of the central drawing panel, they should be removed from the breadboard.
Initial horizontal placement of these rotating "toothpicks" should be random. The speed of their addition should be one new toothpick every 150 milliseconds.
The toothpicks should all rotate at a speed of 0.1 radians per 30 milliseconds, randomly rotate either clockwise or counter-clockwise, and fall at a speed of 1 pixel per 30 milliseconds.
You may find it helpful to abstract the code that rotates a given GLine object by $\theta$ radians into a method rotate(GLine toothpick, double theta) and the code that adds a (randomly placed) toothpick to the non-visible area above the central drawing panel into a method addRandomToothpick(), in addition to fleshing out the normal onButton1Click() and onTimerTick() methods.
You may also find it helpful to know that if a point $(x,y)$ is rotated by $\theta$ radians about a point $(0,0)$, the new location of $(x,y)$ will be given by: $(x \cos \theta - y\sin \theta, x \sin \theta + y \cos \theta)$. That said, keep in mind that you will want to rotate the toothpicks about their own centers, as opposed to $(0,0)$.
Below is a screenshot of what you might see after a few seconds of this program running (although when the toothpicks are both spinning and falling, it looks way cooler than this still image!):
Ever notice how when you purchase something online, and you make one small mistake when typing in your credit card number, the web page immediately identifies this number as invalid? This can be done because credit card numbers are structured to have a built-in protection against "typos" - a check digit.
Credit card numbers can be up to 19 digits and are structured in very specific way: The first six digits make up the issuer identification number (IIN), sometimes referred to as the "bank identification number". As both names suggest -- these six digits identify the issuer of the credit card. After that comes the primary account number (PAN), which can be $6$ to $12$ digits in length. Finally, the last digit is aforementioned check digit -- a digit calculated from all of the preceding digits using the Luhn Algorithm.
To see how the Luhn Algorithm works, let's suppose that the number for which we need a check digit is $7992739871$. Denoting the checksum digit by $x$, our final number will be $7992739871x$. To find the value of $x$ to make the number "valid", we do the following:
From the rightmost digit (the check digit), and moving left, double the value of every second digit. If any of these doubled values have more than one digit, replace the doubled value with the sum of its digits.
Add together the digits resulting from the doubling process with the undoubled digits from the original number.
Only if the total is evenly divisible by $10$ (i.e., if the total ends in zero), will the number be "valid" according to the Luhn Algorithm. Consequently, the check digit should be chosen to make the total evenly divisible by $10$
| Credit Card Number | 7 | 9 | 9 | 2 | 7 | 3 | 9 | 8 | 7 | 1 | $x$ |
|---|---|---|---|---|---|---|---|---|---|---|---|
| Double every other digit | 7 | 18 | 9 | 4 | 7 | 6 | 9 | 16 | 7 | 2 | $x$ |
| Sum digits, as necessary | 7 | 9 | 9 | 4 | 7 | 6 | 9 | 7 | 7 | 2 | $x$ |
In the example above, the bottom row totals $67+x$ which (recalling that $x$ is a single digit) is only evenly divisible by $10$ when $x = 3$. Hence, $3$ is the check digit we seek, and our final number is $79927398713$.
Write a class named CreditCardNumberGenerator that prompts the user to enter a valid IIN (You can look up the bank that goes with a particular IIN here), a primary account number (PAN) length between $6$ and $12$, and some number of credit card numbers desired, $n$. Then, $n$ random (but valid) credit card numbers that could have come from the issuer specified by the IIN, should be printed, one per line. A sample run follows:
$ java CreditCardNumberGenerator↵
Enter a valid 6-digit IIN: 123456↵
Enter desired PAN length (between 6 and 12): 8↵
Enter number of credit card numbers to generate: 5↵
12345675642917
12345654099238
12345665623125
12345619232924
12345656202574
![]() Suppose you are studying populations of a particular type of fish found in three different lakes. For each lake, you are able to make a reasonable projection as to the maximum number of fish that could ever be encountered in that lake, based on various natural limitations (e.g., lake volume, predators, etc...). You also discover that the fish populations in any given year, when expressed as a fraction, $x_n$ of this maximum population, adhere to the following quadratic relationship: $$x_{n+1} = r x_n (1 - x_n)$$ where $r$ is some constant value that depends upon the lake being studied.
Suppose you are studying populations of a particular type of fish found in three different lakes. For each lake, you are able to make a reasonable projection as to the maximum number of fish that could ever be encountered in that lake, based on various natural limitations (e.g., lake volume, predators, etc...). You also discover that the fish populations in any given year, when expressed as a fraction, $x_n$ of this maximum population, adhere to the following quadratic relationship: $$x_{n+1} = r x_n (1 - x_n)$$ where $r$ is some constant value that depends upon the lake being studied.
The fish populations for the three lakes under study for the last 23 years are shown below*.
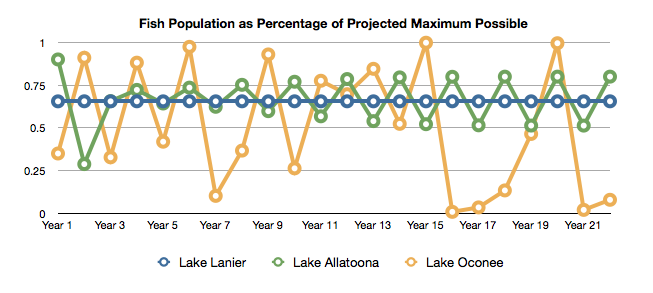
As can be seen, Lake Lanier, which had an $r$-value of 2.9, has a very stable population -- with an essentially constant percentage around $65.5$% of maximum.
Lake Allatoona had a high percentage in the first year of study, presumably due to a change in fishing regulations made at that time. It took a few years to settle down, but this lake has "stabilized" as well -- just in a different way. Here, the populations are oscillating back and forth between $79.9$% and $51.3$%. Lake Allatoona's $r$-value was $3.2$
Lake Oconee's population, on the other hand, is far from stable --with violent, seemingly chaotic fluctuations taking the fish to the brink of extinction. This lake's $r$-value, $4.0$, was the highest encountered.
You would like to get a better idea of what is happening, and so you decide to simulate the fish populations over time for a continuous spectrum of $r$-values, and display the results graphically in the following way:
Starting with $r=1.0$, you will set the initial population of fish as $x_0 = 0.38$. Then, calculating 100 successive values, $x_1$, $x_2$, $x_3$, ..., using the formula given above, you plot points that represent the last $50$ of these $x_i$ values along a vertical line. That is to say, you plot the points $(r,x_{51})$, $(r,x_{52})$, $(r,x_{53})$, and so on... Note, you don't bother plotting the first $50$ points, as you are interested in the limiting behavior for the $x$-values with a given $r$-value. You wish to know if things stabilize, or not. Hopefully, if there is a limiting behavior for a given $r$-value, the populations will be close to it after $50$ generations.
Then, incrementing the value of $r$ slightly, you do it again, just to the right of the line you just graphed (repeating your initial population of $x_0 = 0.38$). You continue in this way drawing dots on vertical lines that creep slowly to the right until you finally get tired ending with graphing the dots on the vertical line that corresponds to $r=3.9$ (since you already know what happens when $r=4.0$)
To your amazement, you get a diagram that looks similar to the figure in black below:
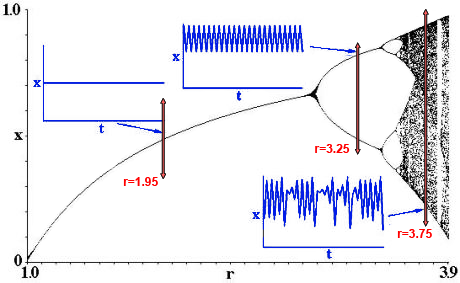
As can be seen by the annotations in blue and red above -- it appears that: As the value of $r$ rises from $1.0$ the limiting behavior is an essentially constant fish population (once enough time $t$ has passed). Then at some point, the limiting behavior changes to oscillating between two values. As $r$ continues to increase, the limiting behavior "bifurcates" again, bouncing back and forth between 4 different values. At some point, however, $r$ reaches a critical size where the limiting behavior becomes non-periodic (i.e., "chaotic"). As you stare at this amazing diagram, you have many questions. You wonder how exactly when the transition from stability to chaos occurs. It looks like there might be an $r$-value where the limiting behavior involves $8$ values -- is there one where it involves $16$ values? ...$32$ values? ...and what's up with that giant gap near $r=3.85$?
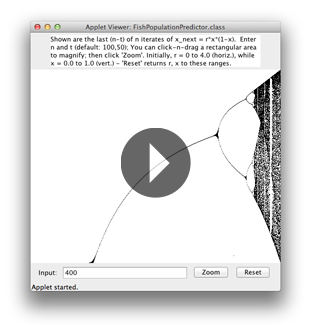
Write a class named FishPopulationPredictor that extends the Breadboard class to investigate this phenomenon further. When executed, a similar diagram should be drawn, but with the user allowed to enter the number of $x$-values to plot for each $r$-value, as well as the number to initially "throw away". The user should also have the ability to zoom in, repeatedly, on different parts of the diagram, as well as resetting the image to its default range of $r=0$ to $r=4.0$.
What happens when you change the initial population value to something besides $x_0 = 0.38$ Does the limiting behavior change?
Check out the video below for how this program might look when executed...
* This is a fictional scenario in the sense that this data was not collected from any real-world lakes -- however, the mathematics here is real. When one finds successive iterates of the equation $x_{n+1} = r x_{n} (1 - x)$, the resulting stability or lack thereof depends entirely on the value of $r$, and in a strange and bizarre way -- as you will see!