|
Some of the exercises below provide sample runs to better clarify what the program in question is supposed to do. In these sample runs, text given in green has been typed by the user, while white text has been output by the program. Additionally, the "$" symbol indicates the command prompt, while the "↵" symbol indicates the user has pressed the return key.
Exercises identified with a breadboard logo ![]() (shown at left) require the following library:
(shown at left) require the following library:
breadboards.jar.
A rumor spreads in the following way: a person picks at random
another person to inform of the rumor. If that person hasn't
already been informed of the rumor, that person starts spreading
the rumor as well. If that person had already been informed of
the rumor, neither person spreads this rumor any further. Starting
with 999 people who don't know the rumor and one who does and starts
spreading it, write a class named RumorSpreader that
simulates this situation and then prints the final percentage
of the population that ends up knowing the rumor...
The median of a list of values is the value that would occur in the center of the list, if the list was ordered from least to greatest, or -- in the case of an even number of values -- the average of the two center-most values in the same ordered list. Write a class named MedianFinder that prompts the user to enter some number of integer values, separated by spaces, and then identifies the median value for this list. Remember, you'll need to sort the integers before identifying the "middle" value.
$ java MedianFinder↵
Enter some number of integers, separated by spaces: 1 2 9 3 7 8 5 4 6↵
The median is 5.0
$ java MedianFinder↵
Enter some number of integers, separated by spaces: 1 2 4 3↵
The median is 2.5
A mode of a list of values is a value that occurs with maximum frequency. Write a class named ModeFinder whose main method prompts the user to enter some number of integer values, separated by spaces, and then prints the number of modes present, followed by the modes themselves, separated by commas. (Note that in the case only one mode is found, the word "mode" when displayed to the user is in a singular form, versus when more than one mode is found, the plural form of "modes" is used instead.)
$ java ModeFinder↵
Enter some number of integers, separated by spaces: 7 1 2 3 2 4 5 2 5 6 8 9 8 10 5 9 8↵
There were 3 modes:
2, 5, 8
$ java ModeFinder↵
Enter some number of integers, separated by spaces: 1 2 3 2 8 9 2 8 9 2 2↵
There was 1 mode:
2
![]() Suppose we wish to write a simple Instagram-like program that will cycle through the application of three filters (i.e., "photo effects") to an image of the user's choice. The three filters that we wish to apply include making the image grayscale; creating an image negative; and blurring the image (the effects of which are shown on the masks of Guy Fawkes below).
Suppose we wish to write a simple Instagram-like program that will cycle through the application of three filters (i.e., "photo effects") to an image of the user's choice. The three filters that we wish to apply include making the image grayscale; creating an image negative; and blurring the image (the effects of which are shown on the masks of Guy Fawkes below).

Use the code in PhotoProcessor.java to get started with this task. Note, code has already been provided to allow the user to load an image from a file, and handles the cyclic display of the images produced. Add the appropriate code to the three methods makeGrayscale, makeNegative, and makeBlurred to complete the PhotoProcessor class.
Note, both the argument and output of the three methods you must write are GImage objects. You may wish to read about the GImage class in the Breadboards API. You may also wish to read Images, Pixels, and the Breadboard Library as you attempt to complete the PhotoProcessor class.
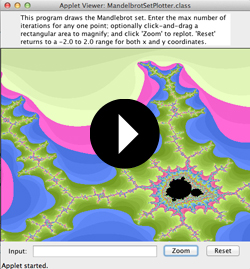
![]() The image below is a section of the famed fractal, the Mandelbrot Set. Fractals are strange sets whose dimension often lies between integers -- that is to say, something more than a line, but not quite a surface; or more than a surface, but not quite a volume; and so on...
The image below is a section of the famed fractal, the Mandelbrot Set. Fractals are strange sets whose dimension often lies between integers -- that is to say, something more than a line, but not quite a surface; or more than a surface, but not quite a volume; and so on...

As it happens, writing a program to draw the Mandelbrot Set is actually very easy to do with a programming language like Java -- as long as you have a basic understanding of complex numbers. With that in mind, recall a complex number is any number of the form $a+bi$ where $a$ and $b$ are real numbers, and $i = \sqrt{-1}$. So for example $(1.2+0.7i)$ is a complex number.
These numbers are added, subtracted, and multiplied together in a natural way (i.e., we treat them like polynomials in $i$, and remember that $i^2 = -1$. For example:
Suppose the central drawing area of the breadboard represents the part of the complex plane where both the real part (the value of $a$ above) and the imaginary coefficient (the value of $b$ above) fall between -2 and 2. Suppose $c$ is the complex number that corresponds to some pixel in this area. For each such pixel and complex number $c$, we create a sequence of complex values $z_0, z_1, z_2, z_3, \ldots$, such that
We say the sequence thus produced from a starting complex value "escapes to infinity" if it contains a term whose magnitude (i.e., distance to the origin) exceeds $2$, as it can be easily proven that the later terms of the sequence start to get farther and farther away from the origin once this happens. Suppose we are interested in seeing which points of the complex plane produce sequences that escape to infinity, and which ones don't...
As a practical matter -- since we can't actually calculate the infinitely many terms of each sequence in finite time -- suppose we calculate $M$ terms of each sequence. If none of the $M$ terms for a particular sequence have magnitude greater than $2$, we color the pixel corresponding to that sequence black. Otherwise, we color the pixel some other color.
Often, for pixels that correspond to sequences that escape to infinity, one chooses the color according to how long it takes to produce the complex term with magnitude (i.e., distance to the origin) is greater than $2$. Calculating the pixel content/color in the following way will result in an aesthetically pleasing image:
//supposing the nth term is the first in the sequence with magnitude exceeding 2...
int blue = 35 + 10 * (n % 23);
int red = 75 + 10 * (n % 19);
int green = 95 + 10 * (n % 17);
The Mandelbrot Set is defined to be the set of complex values that produce sequences that fail to escape to infinity. Write a class named MandelbrotSetPlotter.java that extends the TwoButtonBreadboard class, and plots the Mandelbrot set in black, while coloring the rest of the planar region shown on the canvas using the algorithm above or another one of your own design.
Additionally, if the user clicks-and-drags a rectangle and then clicks the "Zoom" button, the region shown on the canvas should be updated accordingly. If a number has been entered in the breadboard's text field, the maximum number of iterates to be considered should be updated accordingly. Clicking the "Reset" button should return the region of the plane drawn to that between $-2$ and $2$ on the real axis, and $-2i$ and $2i$ on the imaginary axis.
Check out the video below to see what this program should look like when executed...
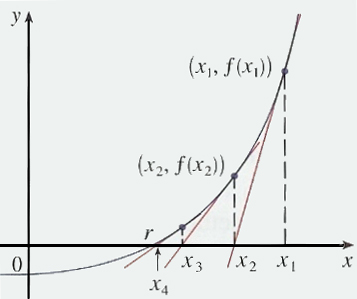
![]() Newton's method provides an efficient way to approximate solutions to equations of the form $f(x)=0$. Suppose you start with a value $x_1$ that you believe to be close to a root. The line tangent to the curve $y=f(x)$ through the point $(x_1,f(x_1))$ is pretty close to the curve, so wherever that line crosses the $x$ axis should be pretty close to the root. Suppose we call this point $x_2$. The tangent line's equation, of course, can be found using the derivative of $f(x)$, and is given by:
Newton's method provides an efficient way to approximate solutions to equations of the form $f(x)=0$. Suppose you start with a value $x_1$ that you believe to be close to a root. The line tangent to the curve $y=f(x)$ through the point $(x_1,f(x_1))$ is pretty close to the curve, so wherever that line crosses the $x$ axis should be pretty close to the root. Suppose we call this point $x_2$. The tangent line's equation, of course, can be found using the derivative of $f(x)$, and is given by:
To find $x_2$, we let $y=0$ and solve for $x$, yielding:
$$x_2 = x_1 - \frac{f(x_1)}{f'(x_1)}$$So now we have $x_2$, a value which hopefully is even closer to the root than $x_1$. By repeating the process above on $x_2$, we can find $x_3$, which is likely to be closer still:
$$x_3 = x_2 - \frac{f(x_2)}{f'(x_2)}$$In a similar manner, we can produce $x_4$, $x_5$, etc... which should provide better and better approximations for the actual root we seek.
Newton's method works great, provided our initial value of $x_1$ is "close enough" to the root in question - much like water poured in a water basin is guaranteed to run straight towards the drain. However, when the initial value of $x_1$ isn't close enough to the root, what happens can be a little strange. For example, we might end up a an entirely different root altogether - or worse yet, we might never converge to a root at all!
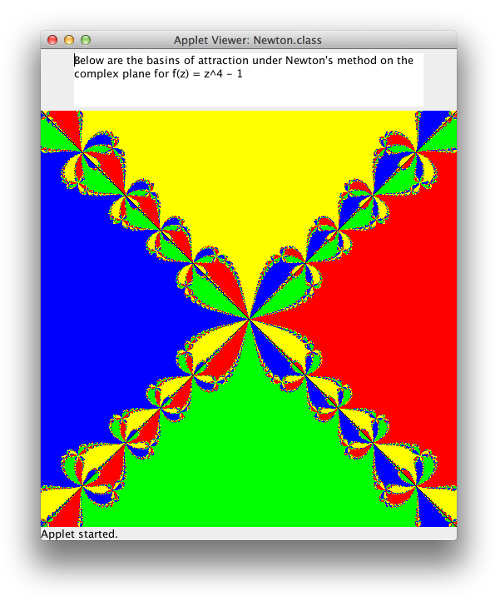
Newton's method isn't limited to functions that only operate on real values -- functions with complex domains will work too. We could, for example, use Newton's method to approximate the four roots of $f(z) = z^4-1$ (i.e., $\pm 1$ and $\pm i$), by picking appropriate initial values of $z_1$ that are "close enough" to the roots. Finding the complex roots of this function is not the interesting piece, however -- they are easy enough to find by hand for this function. Instead, we would like to get a better understanding of what goes on at the edges of the "Newton basins", where we aren't really close to any one root.
Write a Java class named Newton to examine a uniform distribution of points in the section of the complex plane where the real part and the complex coefficient are bound between -2 and 2. Each of the points examined should successively be used as the initial value in a sequence $\{z_i\}$ where
If the sequence approaches $1$, color the initial point red; if it approaches $-1$, color it blue; if $i$ is approached, color it yellow; and if $-i$ is approached, color the initial point green. If everything goes as planned, you should end up with an image like this: